Earnings Beats / Misses
This view is the scoreboard. Every reporting company gets a card showing whether it beat or missed, and by how much against what the street expected.
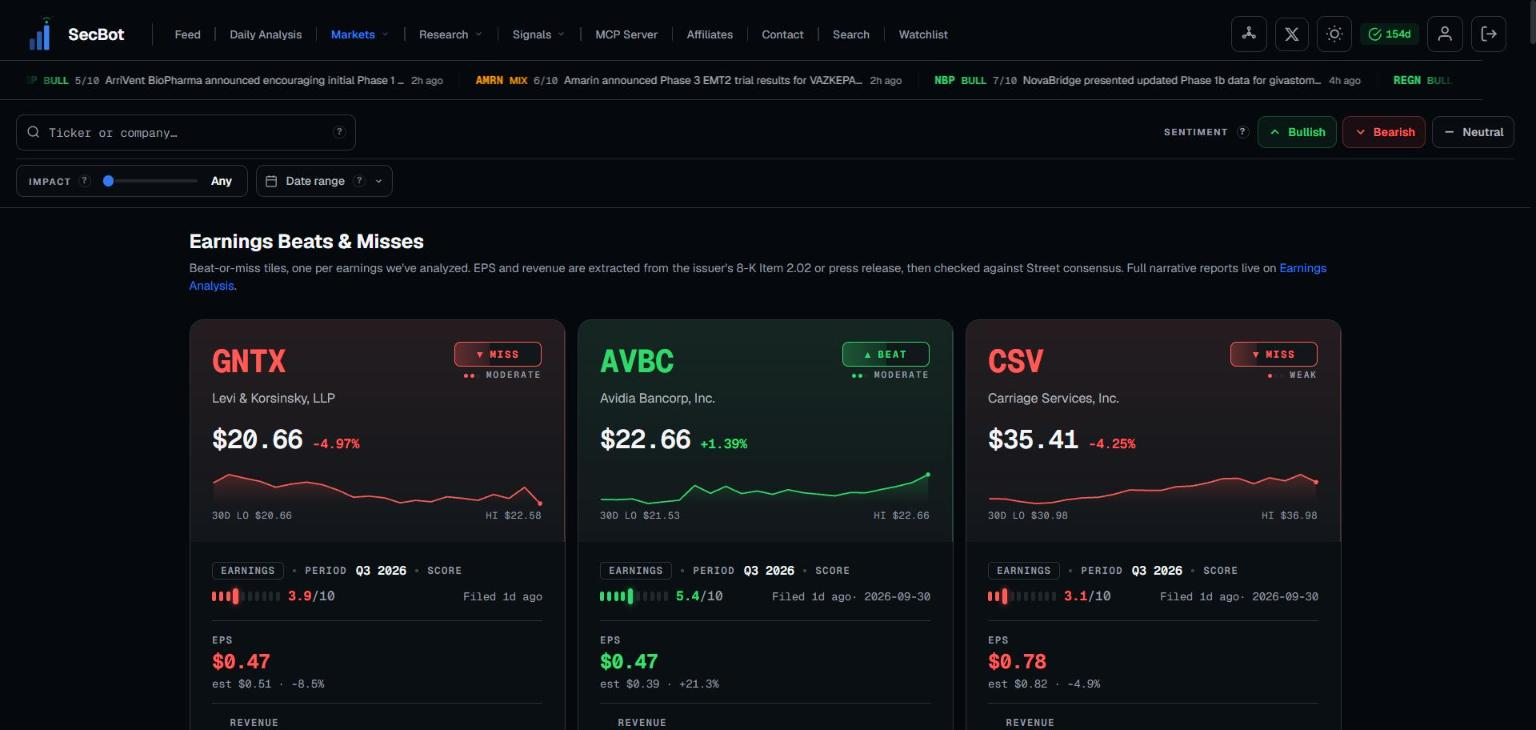 Beat and miss cards with surprise magnitude versus expectations.
Reading the cards
Each card is one company's print at a glance:
- Beat or miss, marked clearly so you can scan a full session of reports in seconds.
- Surprise magnitude — how far the result came in above or below consensus. A penny beat and a blowout are very different events, and the magnitude is what tells them apart.
A big, clean beat against low expectations is a different setup than a narrow beat against a stock priced for perfection. The cards put the number front and center so you can judge that quickly.
How traders use them
The size of the surprise is the part worth dwelling on, because it tends to keep working. Stocks that post large earnings surprises often keep drifting in the direction of the surprise for days or weeks after the print, as the market slowly reprices. That drift is the basis of the PEAD signal.
TIP
Sort the session by surprise magnitude and start at the extremes. The largest beats and misses are where the post-earnings drift is most likely to set up, and they're the names worth a closer look first.
Use this view to find the candidates, then confirm the story before you act. A large surprise tells you something happened; it doesn't tell you the whole quarter was good. Cross-check with Earnings Analysis to see what's behind the number.
Related: PEAD.