Report Analytics
Report Analytics is the scoreboard SecBot keeps on itself. Every report it issues gets tracked afterward, and this view shows how those calls actually performed. It's the transparency page that lets you decide how much trust to put in the scores.
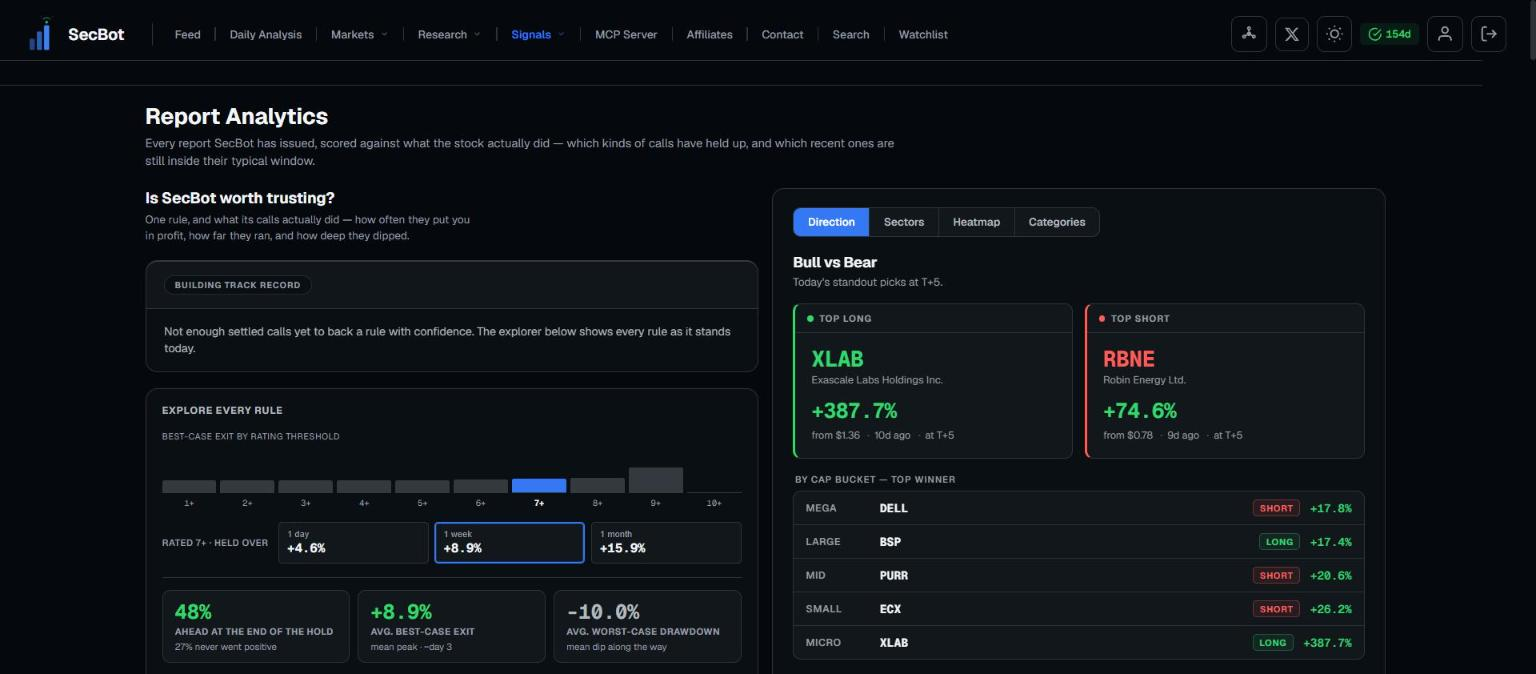 An honest scoreboard for every issued report.
What it tracks
The numbers break down by tier and by confidence, so you can see whether the high-conviction, top-tier calls really do land more often than the routine flow. You'll find hit rates, current and best streaks, and the performance of each band over time. If a particular tier has been running cold, this is where it shows.
That cross-check matters because a score is only as good as its record. The impact score tells you how much an event should matter; Report Analytics tells you how often that judgment has been right.
How to read it
Start with the hit rate for the tier and confidence level you tend to act on. A high-conviction band with a strong rate is one you can lean on. A band that has slipped is a reminder to do more of your own work before acting. Streaks add context but don't over-read a hot run; a small sample can flatter or punish any system.
Nothing here is dressed up. The point is to give you the same record we use to judge the calls, good stretches and bad, so the scores you see across the platform come with their history attached.
Related: Tiers & conviction.